mavacon e.cloud
SaaS Cloud Platform
360 degree management of electrical systems
- Visulization
- Monitoring
- Control
- Maintenance
- Virtualization
360 degree management of electrical systems
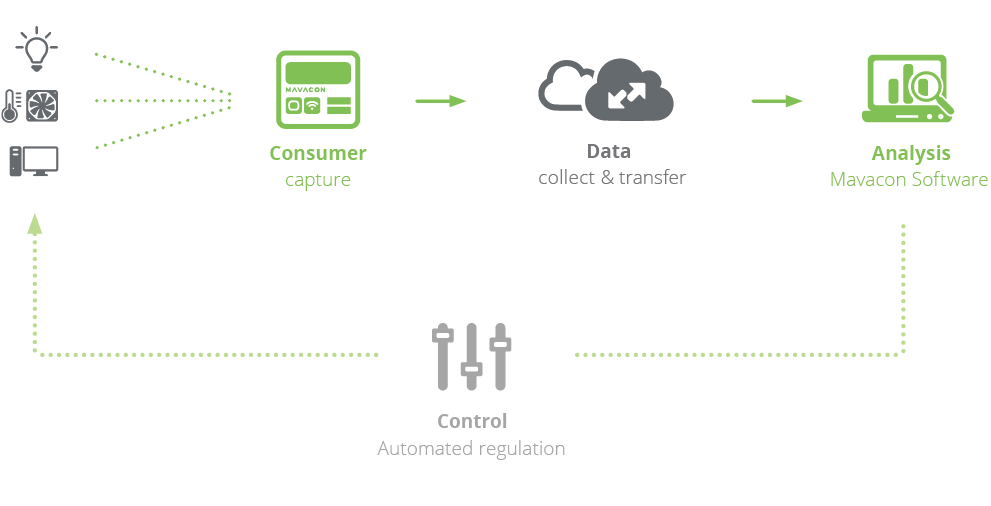
All data is displayed in real time and converted into structured and clear diagrams. The benchmark function allows you to plan equally your energy footprint as well as filtering out the worst energetic properties to work specifically on the energy optimization.
For effective and customized energy controlling the tool is a leader in user experience, analytical skills, performance and flexibility!
Customization and clear grouping for small businesses, large companies with multiple locations or for public buildings. Sehen Sie auch unsere Fallbeispiele für: Ladengeschäfte, Bürogebäude und Industrieanlagen.
 for small businesses
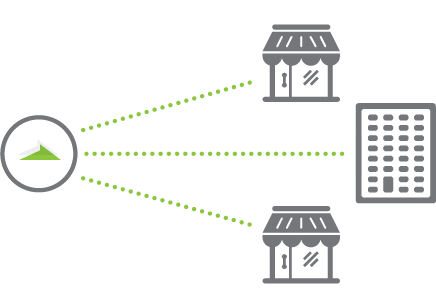 for large companies

The user receives an accurate graphical representation of the current operating data (such as electricity, water, gas, temperatures, etc.).

The software processes, thanks to HTTPS protocol, all data secure and confidential.

The user can access the information in any web browser.

The software can be viewed easily from any internet-enabled computer, tablet and smartphone.

Quick overview of the collected energy levels and provides energy and facility managers with detailed performance and operating information.

Detailed, central overview of the energy consumption of a single or multiple locations.

Past, current and forecast data on energy sectors and trades on the buildings up to the exact total consumption of all detected objects.
 Screenshot: Dashboard-Overview

The performance indicator reflects the actual consumption data in real time.

Provides the ability to analyze individual circuits during a certain period, so that wasted energy, consumption or irregularities can be determined precisely.

The data can also be easily exported to third-party users or interact directly through the open API.

Allows users to view the consumption data per specific location and circuit and to correlate with the ambient or external temperature.

Displays by heatmap the energy consumption and displays it visually to make unusualness in energy consumption immediately visible.

Normalized energy consumption with weather data and other site-specific parameters. Weather-adjusted to compare the efficiency between sites and systems.
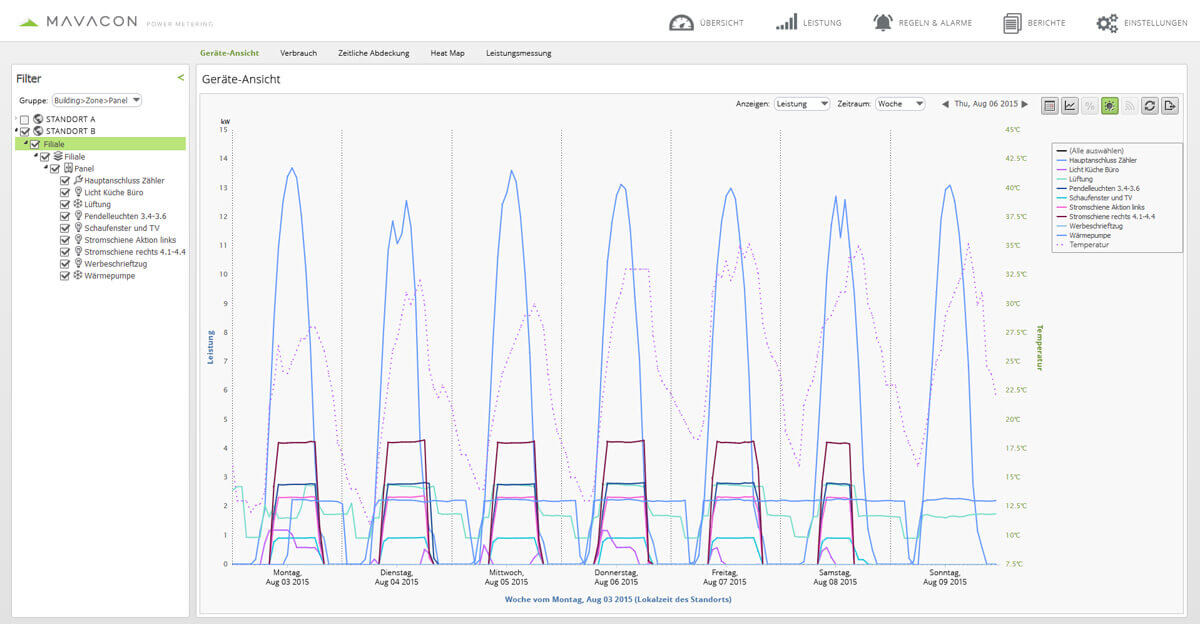 Screenshot: Device-Overview
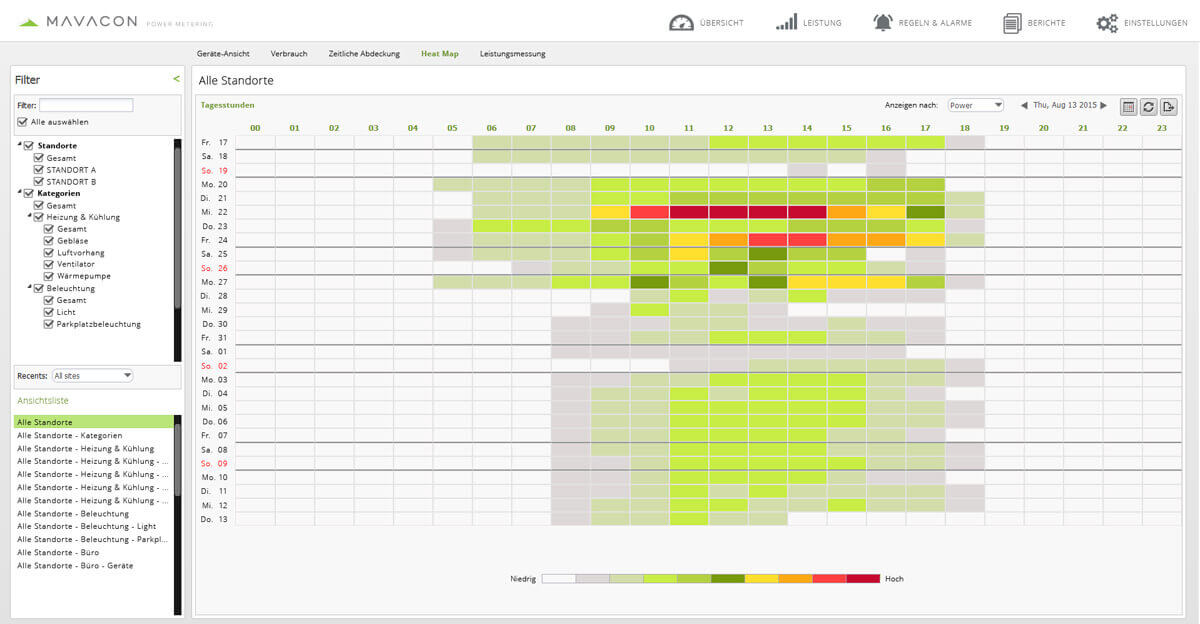 Screenshot: Heat-Map-Overview

The user can easily automate complex and rule-based events and alerts through energy patterns, status and thresholds and therefore trigger everyday processes.

Different types of predefined alerts can be triggered as soon as a threshold or a combination of threshold and temperature is met.

Alarms can be sent via SMS, email or HTTP post notifications to the appropriate persons.
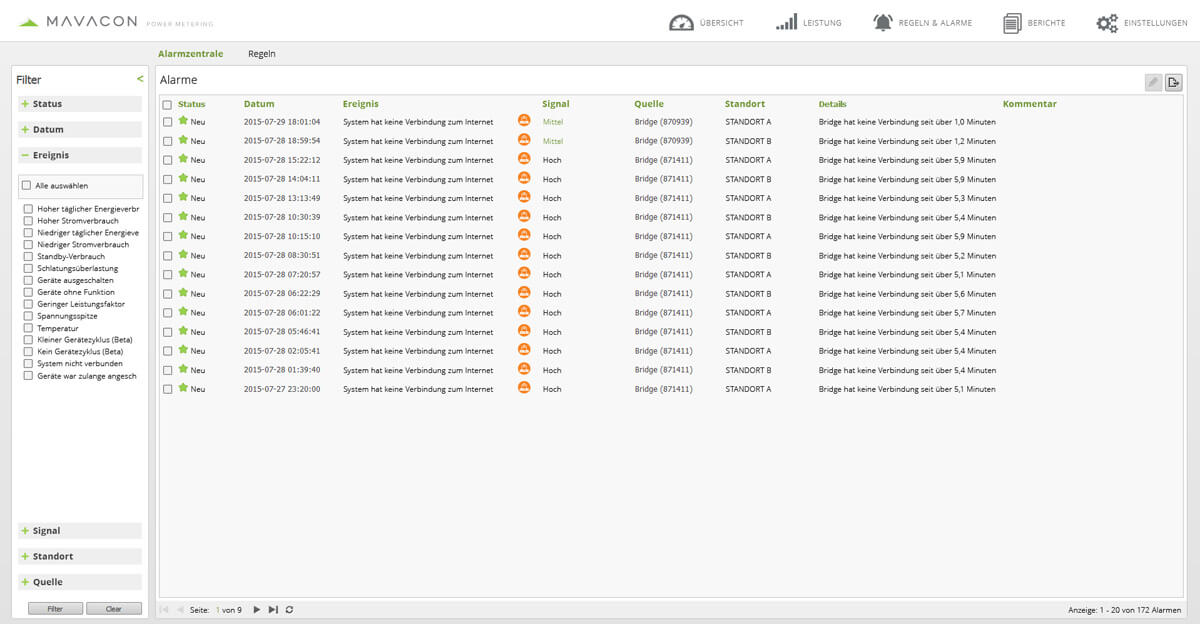 Screenshot: Alert Operations Centre

Detailed information on the energy consumption of individual and multiple sites as well as the alarm history can be retrieved for further processing in large reports, exported, and printed automatically.

Automatically generated reports can be saved for a predefined schedule for users across the enterprise or sent by e-mail.
 Screenshot: Reports-Overview

The software includes a rights-based access control, so that logics, physical location informations, electrical hierarchies as well as action terminations and much more, can be stored and saved only by authorized personnel.

The application was designed to host hundreds of thousands of sensors and circuits through a modular and scalable structure in the cloud. You can manage and support thousands of locations globally and in real time.

All data will be back-uped and are available in the archive. The update intervals can be chosen according to need.
An open API and out-of-the-box adapters allow the integration of third party applications, such as billing systems like, SAP®, Oracle, Sage, Microsoft, Infor, Johnson Controls, Evon XAMControl, Copadata zenon, ODOO, etc. or bus systems such as KNX, DALI, Smart-Bus, G4 bus, DMX, etc. It can also transfer and import data from smart meters and other environmental sensors.
All trademarks, logos and company names are the property of their respective owners.
Mavacon Power Metering
Flurweg 11
82402 Seeshaupt
Germany
Tel.: +49 8801 / 9119 - 030
Fax: +49 8801 / 9119 - 013
E-Mail: contact@mavacon.eu
Mavacon is a trademark of 010 Digital GmbH
Do you have a technical problem or need help fast?
We are happy to provide you support!
You can imagine a collaboration with Mavacon?
We want to talk to you about a possible partnership!
Do you have any questions or would you like to make an inquiry?
Please feel free to contact us in all matters!
We would like to keep you updated about the latest developments that could be valuable for you and your work. Our specialist for complex building and lighting control systems – livebau smart electric – provides our customers and those who are interested with a bimonthly newsletter containing up-to-date information on the topics of automation and smart sensing technology. Our newsletter is for free and your subscription will begin with the next issue of the newsletter.
If you have any further questions, please write us an e-mail: service@mavacon.eu.